
|
|
Where does innovation come from?

Where does innovation come from?
May 4, 2016
The growing talk of innovation within the supply chain over the last few years has had a positive effect on the logistics industry. Not only has it led logistics providers to begin embracing technology and new business models with the same relish as other more forward-thinking industries, it’s also changed the perspective of many supply chain leaders.
It’s not hard to see why innovation is such a hot topic, either. Step down from the strategic level and innovations can be seen to variously improve efficiency, reduce risk, drive cost effectiveness, enhance profitability and position logistics providers to tackle today’s challenges whilst looking ahead to tomorrow’s. Indeed, the potential rewards to be found from innovating in logistics and supply chains has seen many from outside the industry seeking to enter and claim their share of the spoils, including Google which was recently awarded a patent for an ‘autonomous delivery platform’ (essentially a self-driving truck with parcel lockers on the back), for example.
And where Google goes, others in Silicon Valley are sure to follow. Funding for transportation-focused start-ups doubled from $7bn in 2014 to $14bn in 2015, according to Volvo Group Venture Capital. Logistics start-ups have emerged promising to disrupt, unbundle and revolutionise the industry with services ranging from marketplaces to Big Data platforms to on-demand shipping. The opportunity to solve problems and overcome challenges with solutions built to scale rapidly has become a well-funded and rapidly growing source of innovation in many industries. Maybe now it’s logistics’ turn.
Source: Transport Intelligence, 4th May 2016
What is IOT
What is IOT and what possibilities it can bring us in future logistics and supply chain management. Great video from IOT Asia Exhibition and Conference
What is TIR system?
Global, seamless and certain. TIR is the easiest, safest and most reliable way to move goods across international borders, saving time and money for transport operators and customs authorities. TIR is the world’s only universal transit system
Drewry Unveils Findings of Key Whitepaper 12/04/2016
Drewry Supply Chain Advisors’ recent whitepaper entitled ‘A Best-Route’; a market study for containerised imports to South Germany’, has found that the traditional gateway ports in North-Western Europe no longer hold all of the trump cards.A recently published whitepaper from Drewry’s Supply Chain Advisors looking at the ‘Best Routes’ for containerised imports into South Germany from China found that for some shippers using Mediterranean gateway ports, this is a viable alternative to the traditional North-West Europe gateways.
To establish shippers’ best-route Drewry examined a variety of routes to find the best mix of cost, transit time and the number of service options.
Read the full whitepaper here
Firstly, the whitepaper looked at the number of maritime services from Shanghai to South Germany’s so-called Northern and Southern gates that were available to the market as of March, 2016.
(Source: Drewry Supply Chain Advisors)
Here Drewry found that there were far more weekly connections to the two major Northern gateway ports of Rotterdam and Hamburg, but while South gate ports had fewer services, they had the advantage of faster transit times, by virtue of being in closer proximity to Shanghai.
Then we looked at the intermodal connections between those gateway ports and five logistics clusters in South Germany. Here we present some of the findings for Munich, the best connected of those clusters with rail connections to all of the relevant ports.
The cheapest option for Southern Germany shippers was via Rotterdam and Hamburg, but only by a margin of US$150 and $100, respectively against Koper in Slovenia, which has a three-day transit time advantage.
As such, Drewry believe Shanghai-to-Munich via Koper is a true ‘Best-Route’ contender for shippers with time sensitive cargoes.
There are also other reasons why Drewry thinks the Southern gate will become more competitive. Firstly, the ocean freight rate differential for cargoes from Asia to North and South European ports is changing; the former has traditionally been cheapest but in the fourth quarter 2015 the World Container Index reported that ex-Shanghai rates to the Mediterranean were lower than to North Europe in 10 out of 14 weeks.
Secondly, several South European intermodal operators are developing exciting and competitive concepts. These efforts will be boosted when the Gotthard Base Tunnel (GBT) opens in June.
The GBT will be the world’s longest traffic tunnel and will allow rail operators to improve their efficiency by increasing the length of the trains and reducing the travel time when crossing the Alps. Once this translates into cheaper rail rates, the area where the Southern Gate can compete will expand further North.
The Drewry View: More shippers will look to route via Southern gateway ports as the maritime price differential equalises and intermodal connectivity improves.
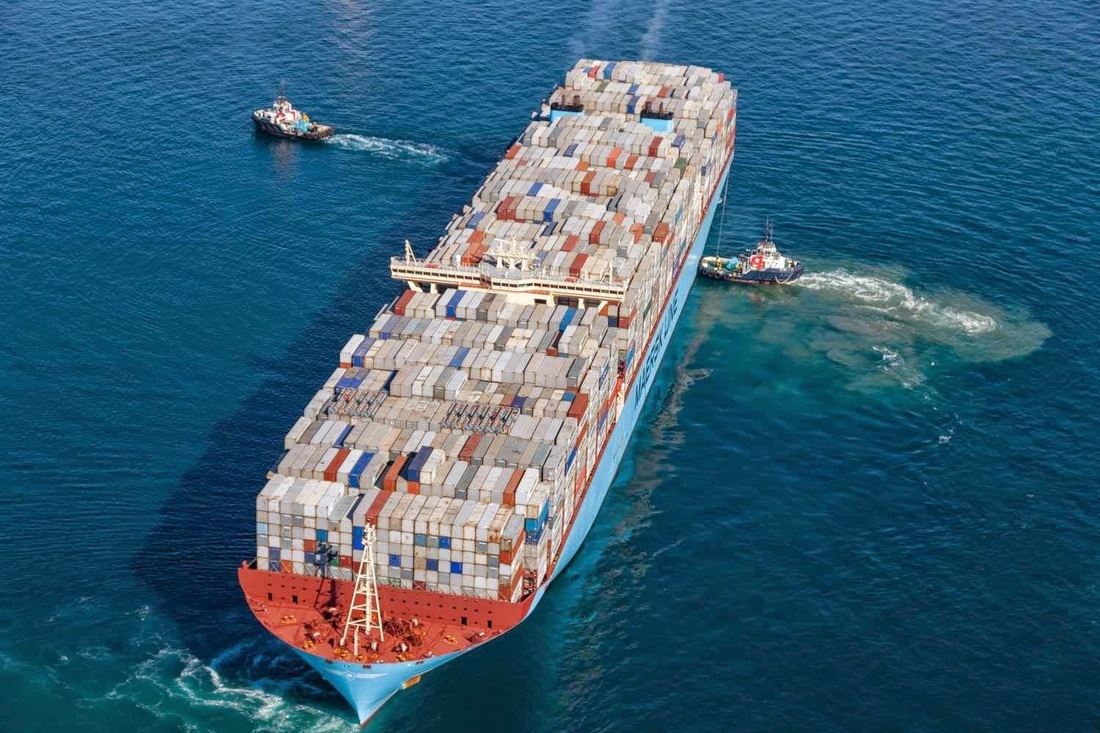
Will the era of “mega vessels” be short lived? 07/04/2016
The three largest carriers in the world – Maersk Line, MSC and CMA CGM – extended their dominance by taking on the most capacity, while the five leading carriers between them accepted two-thirds of all the new capacity.
Analysts for the London-based consultancy, Drewry Maritime Advisors, say that the trend of “big ship obsession” may soon come to an end.
As reported in LM, the three largest ocean carriers in the world – Maersk Line, MSC and CMA CGM – extended their dominance by taking on the most capacity, while the five leading carriers between them accepted two-thirds of all the new capacity.
The emphasis last year was on the big ships; deliveries of 10K+ ships amounted to 55% in twenty-foot equivalent units (TEUs) of all deliveries
Ships of 10,000 TEU or above now constitute approximately one-quarter of the cellular fleet on the water, having only taken up less than 5% at the end of 2011. That share will only continue to rise as ships of that size currently make up around three-quarters of the total orderbook.
Looking further into the future carriers will have to continue to juggle new ship capacity with even more dexterity; new orders doubled in 2015 to an aggregate capacity of 2 million (90% of which were 10,000 TEU and above) that will have to find deployment before the decade is out, say analysts.
Most of the new orders occurred in the first nine months of last year as things cooled off in the fourth quarter. Newbuild prices are still very attractive and shipyards are very keen to generate business so the recent slowdown is either a signal that owners have realised there is no demand right now for any more new ships and/or that financial pressure among carriers and non-operating owners is suppressing activity.
“We think there are reasons that the big ship obsession could be about to end,” said analysts.
Research done by Drewry Maritime Advisors suggests that the economic argument for ordering ever bigger ships diminishes as they grow and actually reverses upon reaching 24,000 teu as ports struggle to turn them around efficiently and the total system cost rises.
“We know that for each individual company the desire for big ships is logical, but the impact on the industry at large has been disastrous with rock-bottom freight rates that we’re seeing now the end result,” added analysts.
“Carriers are running out of profitable trades to deploy the big ships. If we’re right that the economic imperative and the financial ability to order these ships is decreasing we think there is a reasonable chance that the much needed breather from new orders will hold firm,” Drewry concluded.
What Keeps Supply Chain and Risk Managers Up at Night? 07/04/2016
Every type of business risk has an impact on the supply chain. And when risk becomes reality, risk managers and supply chain managers work in tandem to keep goods and materials flowing.
- Theft, fraud, and corruption. While they rank tenth for corporations overall, theft, fraud, and corruption are the top risks for the transportation industry.
- Political risks. Refugee crises, terrorist attacks, and wars number among the many political factors that stress risk managers. These events can drastically disrupt the supply chain.
- Fires and explosions. The average fire and explosion incident costs a company $1.8 million, the Allianz report states. With that sort of price tag, you can bet the thought of a facility or equipment fire keeps risk managers tossing and turning.
- Loss of reputation or value. Corporations risk financial losses if their global reputation takes a plunge. To mitigate this risk, many companies focus on environmental initiatives and social responsibility programs.
- Macroeconomic developments. Cheaper commodity prices and inflation are impacting the United States and many of its global trading partners in unexpected ways. Lower oil, gas, and steel prices are actually stressing the supply chain in some ways, the report notes.
- Changes in legislation and regulation. Governments sometimes enact economic sanctions and protectionist policies that leave businesses trading with those countries at a disadvantage.
- Natural catastrophes. Losses due to natural catastrophes were at their lowest since 2009, according to the report, dropping the category down two places from its number-two position in 2015.
- Cyber incidents. The risk of cyber-crimes, data breaches, and IT failures gets higher year over year, and is the greatest long-term future risk, according to the report. Many companies don't have the resources to keep up with this rapidly changing threat, making it one of the most difficult to prepare for.
- Market developments. Non-traditional competitors and startups wielding new methods and technology have also become a concern, with 34 percent of respondents citing market developments as a top issue.
- Business interruption. Business interruption (BI), including supply chain disruption, holds its place at the top of the list for the fourth year in a row. While on the surface, this issue may not seem larger than some of the others, the fact is that BI is the end result of most of the other risks on the list.
Interim and transformation leaders have worked across 91 percent of the globe 31/03/2016
Interim and transformation leaders have worked on assignments covering 91 percent of the globe, that's according to the findings of The WIL Group's first ever global interim leadership survey.
The research showed that these top level executives have worked in a total of 178 countries. And almost three quarters (72 percent) of assignments had an international component, with the majority of respondents spending their time in another country, and many across multiple international locations.
France proved to be the highest ranked, in terms of assignment locations away from the executive's home country - standing at 32 percent. This was closely followed by Germany (29 percent), the UK (28 percent) and the USA (23 per cent).
These executives operate at the top levels of an organisation and fit into two main categories - 25 percent operating as CEO, and 23 percent working on change and transformation roles involving project and programme management, restructuring and turnaround. In addition, 13 percent work at CFO level and - unsurprisingly - there is strong representation of executives handling technology and digital programmes.
Over half (57 percent) have worked as an interim and transformation leader for more than three years, and 19 per cent for more than 10 years. On average these talented business executives have completed seven different assignments, each lasting typically 10.5 months.
Our prognoses is that future management will move awards interim based contracts (1-3 years) for top leaders.
Predicting the Future in logistics and impacts to the customer experience 22/03/2016
Logistics technologies are already giving customers better and more valuable information to drive their decision making and increase efficiency, and cutting-edge developments like wearable will continue to connect shipments and people in more useful ways. The final trend—one which we’re just seeing the beginning of—is predictive analytics.
With the increase and integration of information across the supply chain, we hone our abilities to help customers more accurately predict how their shipments can move most efficiently. If we can help our customers plan for how their shipments will be affected in the future, then they can budget and plan for controlling their transportation costs.
I know from my years of experience in marketing and sales that having great technology has no intrinsic value–it comes from how that technology is used to provide benefits to our customers and great productivity to our employees. Listening to customers and thinking about how emerging technologies can address their needs will help companies to make a difference.
Here is a great video from Dimension Data about the Collaborative Supply Chain 22/03/2016
- Collaboration Increases Share of Wallet: This simply means over time you gain a deeper relationship, thus in the trust of the customer, you gain more of the business.
- The Longer the Collaboration, the Lower the Costs: Over time, trusted collaboration begets an understanding so intimate, you begin to understand each other and almos "finish each other's sentences." Simply put, you know internal processes and have a work flow that minimizes resources spent on administrative or time intensive tasks.
- The Power of Word of Mouth: The old saying is true "If you do right by someone (in business), they will do right by you." Referrals are the life blood of any business, and if trust and collaboration is a part of a business relationship, a supplier, OEM, or the 3PL can refer you to get more business.
- Innovation through Long-Term Collaboration: This goes back to the second point. The more you understand the pains and the processes of the client the easier it is to lead towards innovative ways which lead to further hard and soft cost savings.
First train completes Dalian-Kaluga run on New Silk Road route 06/02/2016
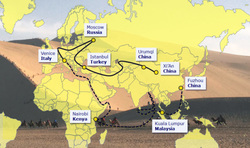
Dalian-Kaluga: The first freight train to make the journey along the latest New Silk Road intermodal route between Dalian in China’s northeast Lianoning province and the Russian town of Kaluga (150km south west of Moscow) reached its destination yesterday, nine days after setting off. The train was carrying 100 standard containers packed with goods produced by Samsung Electronics in South Korea.
Although the cost of the new service is about the same as by the conventional maritime route, it cuts about three weeks off the journey time.
Its arrival marked the opening of a new international logistics channel jointly developed by China, South Korea and Russia with Dalian Port planning to open three more ‘sea-rail channels’ to Europe. As Northeast China’s cross-border frontier entry point, Dalian Port deals with around 90% of the region’s exports. More..
The Global Risks report 24/11/2015
|
The 2015 edition of the Global Risks report completes a decade of highlighting the most significant long-term risks worldwide, drawing on the perspectives of experts and global decision-makers.
Read More |
Cargo Safety & Security in food and beverage
27/10/2015

As a sector, food and beverages are particularly vulnerable to theft. Indeed, the sector ranks as the number one target for thieves according to companies that monitor such activity. For consumers that unknowingly buy goods from retailers who procure food or beverage products from the gray market, the risks are compounded when safe handling, including temperature monitoring, are neglected.
Following are three perspectives from industry executives that shed light on current trends and developments relating to cargo theft and how best to combat the risks
According to FreightWatch International’s U.S. Cargo Theft Intelligence Report Q2-2015, food and drink has been the most frequently stolen type of freight since 2008. Given that food and drink products are difficult to recover because of how quickly they can go to market, they are “hot commodities.” Despite their propensity for theft, however, they can be safely transported, warehoused or protected from contaminants if proper safety protocols are in place and red flags identified in the supply chain.
Not only does food and beverage cargo theft affect the bottom line for the growers and manufacturers of these products, but also the consequences can be deadly for the general public. Imagine that a truck carrying cases of baby formula is intercepted and a number of boxes are stolen, tampered with and repackaged with a different substance. The potential for disaster for a number of babies and their families can be unimaginable if this formula is somehow placed back in the legitimate supply chain.
For freight forwarders, security should be paramount at all times, en route to long distances, during local shipments, at the warehouse and in containers.
Read More
Container volume trends middle east/south Asia 2015
26/10/2015
Healthy container volume growth from Europe into the Middle East and South Asia in first half of 2015. The ability of Middle East and South Asia economies to generate demand in their own right is evident from container trade figures for the first eight months of 2015.
According to Drewry Maritime Research, eastbound Europe to Middle East/South Asia trade has significantly outperformed traffic in the opposite direction.
After eight months, Europe to South Asia volumes were up 5.6% to 825,000 TEU. In the bigger Europe to Middle East trade, growth has been even more impressive at 9.4%, giving year-to-date volumes of 1.56 million TEU.
Conversely, westbound traffic has been much less flourishing. Middle East to Europe volumes were up by only 1.6% after eight months to 475,000 TEU, while South Asia to Europe volumes fell back by 3.5% to 1.11 million TEU.
Drewry goes on to say that the rolling 12 month average of container traffic on this route illustrates how sizable the gap between the two lanes has become. As of August, the eastbound trade was up by 10.7% year-on-year, leaving westbound traffic languishing in negative growth at -0.9%. While eastbound growth may have plateaued, it is still far healthier than the westbound lane.
Port investment
Such healthy traffic on eastbound routes highlights the need for sufficient - and efficient - port capacity in the region.
Recently, India announced that it is to shelve plans to privatize its major container ports which Drewry suggests could lead to a shake-up of container port options in the region over the medium term. The government has based the decision on improved port performance that has, in its view, negated the need for a mass sell-off.
Container Shipping Schedule Reliability Is Getting Worse
20/10/2015
Container shipping schedule reliability on the three main east-west trade lanes fell to a record low of 48.6% in January, according to Drewry’s latest Carrier Performance Insight report, as US west coast port congestion and the bedding in of new alliance services took their toll on vessel on-time performance levels.
Maersk Line was again the most reliable carrier with an average on-time performance of 76% in January, but there was a long gap to the second place claimed by Cosco with 61% while the league table was propped up by PIL on a lowly 21%.
Read More
Maersk Line was again the most reliable carrier with an average on-time performance of 76% in January, but there was a long gap to the second place claimed by Cosco with 61% while the league table was propped up by PIL on a lowly 21%.
Read More
Does temporary migration increase trade and logistics?
15/10/2015

In a situation of lacklustre growth, increasing international competition, and a migration crisis, the EU is struggling to develop a (more) common labour migration policy as well as a modern trade policy. These efforts are mainly conducted in separate silos, yet recent research shows that they ought to be closely connected. Facilitating movement of people across borders is in fact a highly useful tool for engaging in and benefiting from specialized and internationalized production networks.
Migrants provide networks and market knowledge
The association to exports is stronger for recently arrived migrants than for permanent migrants, especially in services. This supports the idea that recently arrived migrants are hired for their up-to-date market specific knowledge and/or network links to their countries of origin.
Other findings corroborate this idea.

|
Transport Trends
25/09/2015
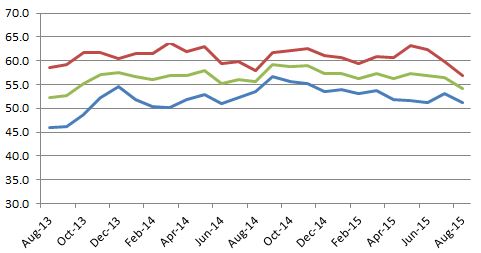
The Stifel Logistics Confidence Index
The Stifel Logistics Confidence Index fell for a third consecutive month in August. With the Index now at 54.1, the first eight months of 2015 have been marked by general decline. Indeed, not only is the Index now at its lowest point of the year so far; fierce competition, volatility and overcapacity have all taken their toll and driven the Index to its lowest point since September 2013.


Road HaulageFreight transported by road and rail in the EU remain below pre-crisis levels, if measured in tonne-kilometres of goods moved, reflecting continuous weak domestic demand. Rail freight volume in China shows increasing pace of slowdown and declined to 6% above pre-crisis levels, possibly suggesting weakening of the growth.
Global value of over 2 Trillion dollars. Source: ITF 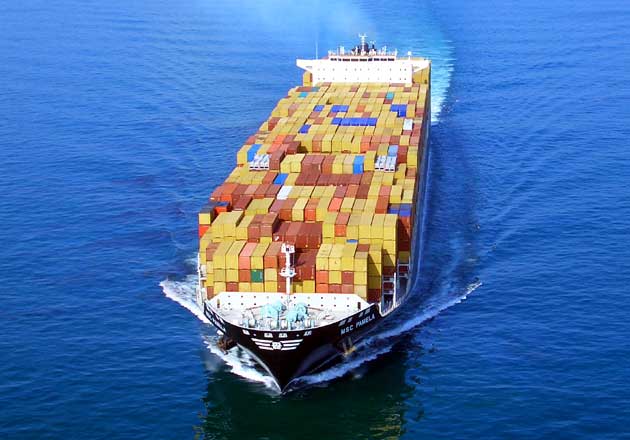
Sea FreightTotal external trade by sea grows both in the EU-28 and the United States, recovering to pre-crisis levels (-1%) in the former, measured in tonnes of good carried
Total exports transported by sea reach 28% and 22% above pre-crisis peak in the EU-28 and the United States respectively while imports stagnate below pre-crisis levels (EU -9%; USA -26%) Global value of 54 billion dollars. Source: ITF |
Container transportGlobal TEU volumes increased by 4% in 2014 to 135.4 million TEUs, the Port of Rotterdam Authority reports.
Inter‐continental trade rose by 3.4%, while intra‐regional volumes increased by 5.4% to 30.4 million TEUs. 2014 TEU volumes carried to and from Europe (including all countries bordering the Mediterranean) and between European countries increased by 5.4% to 46.9 million TEUs, according to Container Trades Statistics (CTS). Imports grew faster than exports: by 5.7% and 4.5%, respectively, while regional trade (excluding feeder boxes) was 7.3% higher. Exports from Europe increased on all routes, except for Latin America. Trade to North America has benefited from the depreciation of the Euro against the US dollar, leading to a growth of 9.6%. Trade to the Middle East/ISC also rose by 9.1%. Exports to the Far East increased by 1.3%. Containerised imports into Europe were higher, this particularly due to a high 7.4% rise of Far East imports and a significant trade increase with the Middle East/ISC. The containerised imports from the US to Europe declined by 1.2%. Container Trades Statistics cover overall inter‐continental deep sea routes and around 85% of the worldwide full container trade, and do not include feeder containers. Source: Clarksons |

Air freightTotal external trade by air, in tonnes of good transported, recovers to 2% above pre-crisis peak for the first time since the second quarter of 2012, according to our seasonally adjusted preliminary data
Source: ITF |
Recent News
The Impact of Mega-Ships
Ever bigger container ships inspire awe and fascination, and are one of the hottest topics in maritime transport says ITF. They are also a headache for ports and terminals – mainly because of their vast size. Although economies of scale allow vessel costs per volume transported to decrease with bigger ships, the on-land costs of handling those volumes increase. Together, these two costs determine the total costs for the transport chain. There are also several supply chain costs and risks related to mega-ships. There are adaptations needed to infrastructure and equipment: the ships are longer, wider and deeper which has consequences for cranes, quays, access channels and all that. Mega-ships stay on average 20% longer in ports – quite an achievement for most ports as this requires massive efforts to accommodate these longer-stay guests. The higher risks associated with mega-ships are linked to difficulties in insuring and salvaging in case of accidents. Furthermore, mega-ships mean that more cargo is concentrated on a single ship, leading to lower service frequencies and lower supply chain resilience – all your eggs in one basket. |

Investment in Inland Transport Infrastructure
at Record Low The latest ITF Statistics Brief shows that the continued economic crisis has had an impact on transport infrastructure investment:- Investment in inland transport infrastructure, as a share of GDP, has declined from a peak in 2009 to a record low (0.8%) in the OECD while the volume of investment has fallen back to 1995 levels. - European countries have nearly halved since 2009 in real terms, accounting for 1.0% of GDP in 2013 (compared with 1.9% in 2009). - Western European and North American economies invest increasingly in rail while in Central and Eastern European countries the focus continues to be on roads. |
